Net sales by segment
|
FY2021 |
FY2022 |
FY2023 |
FY2024 |
FY2025 |
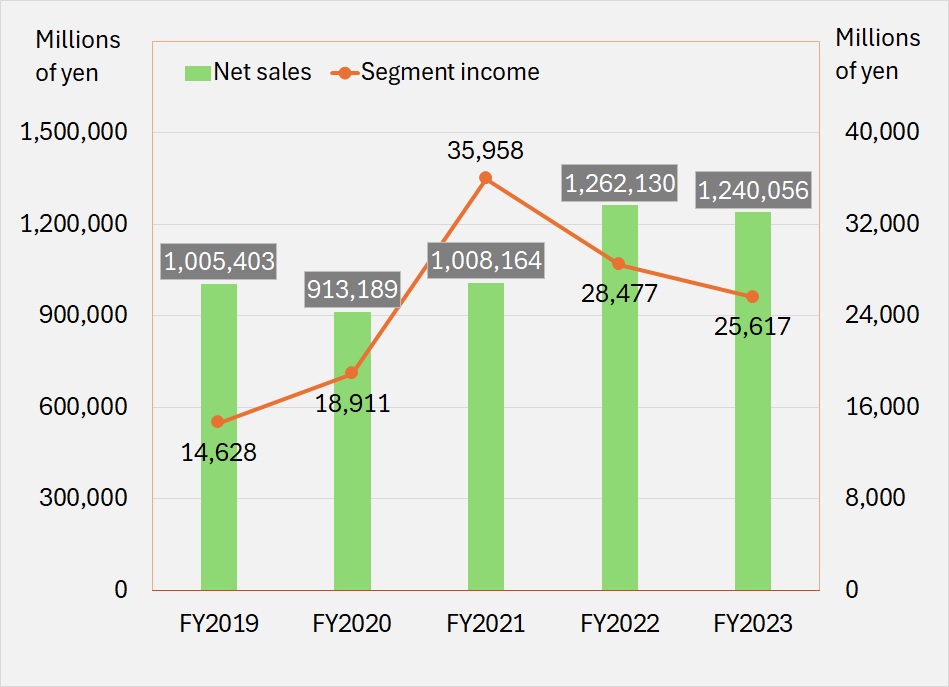
| Steel (Millions of yen) |
1,008,164 |
1,262,130 |
1,240,056 |
1,155,245 |
1,071,913 |
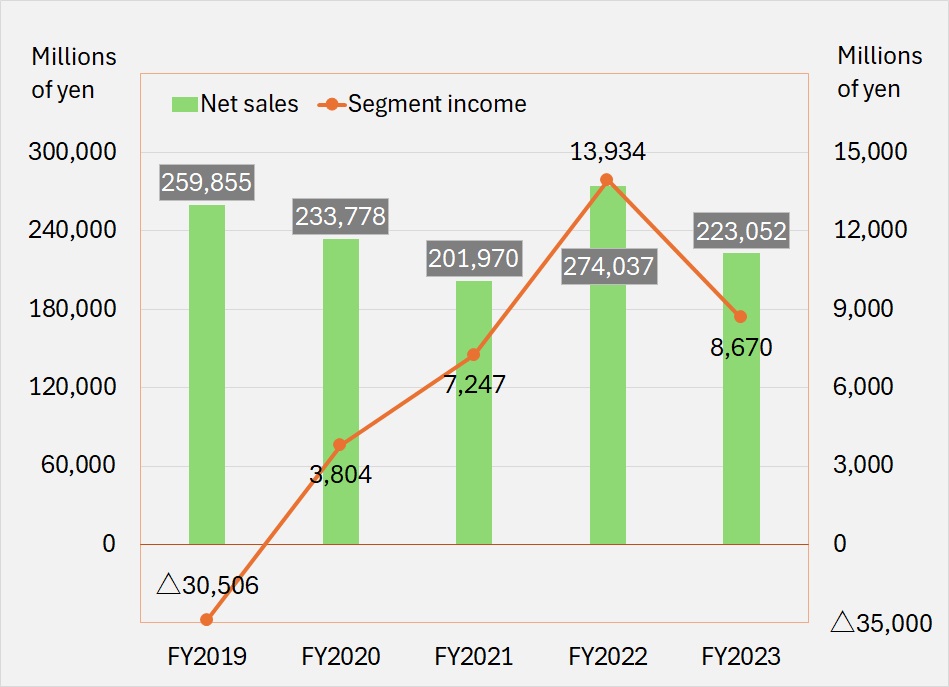
| Primary Metal (Millions of yen) |
201,970 |
274,037 |
223,052 |
184,220 |
244,105 |
|
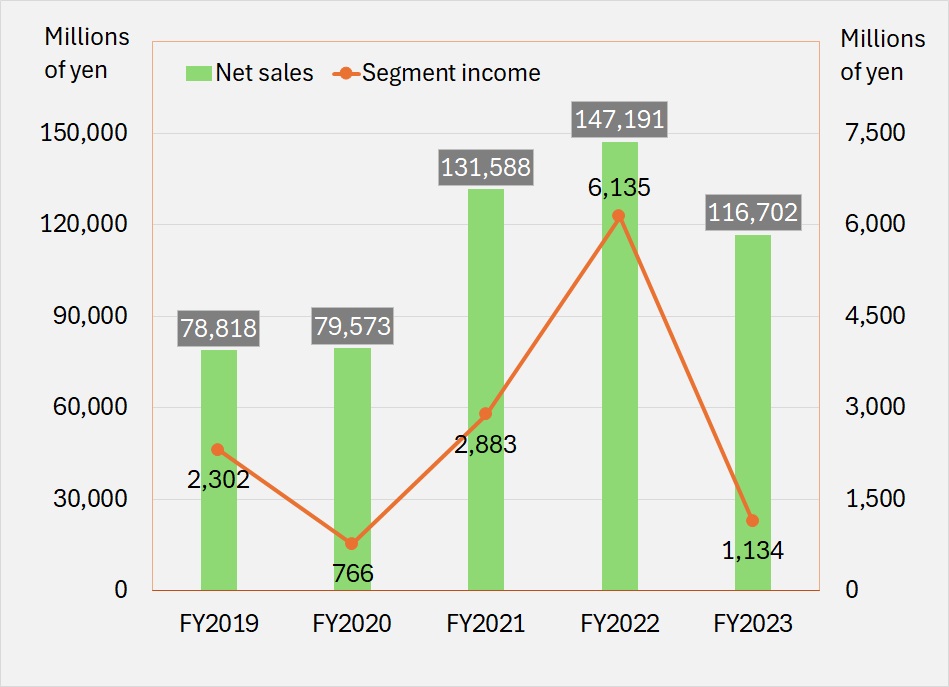
Metal Recycling (Millions of yen)
|
131,588 |
147,191 |
116,702 |
226,840 |
284,212 |
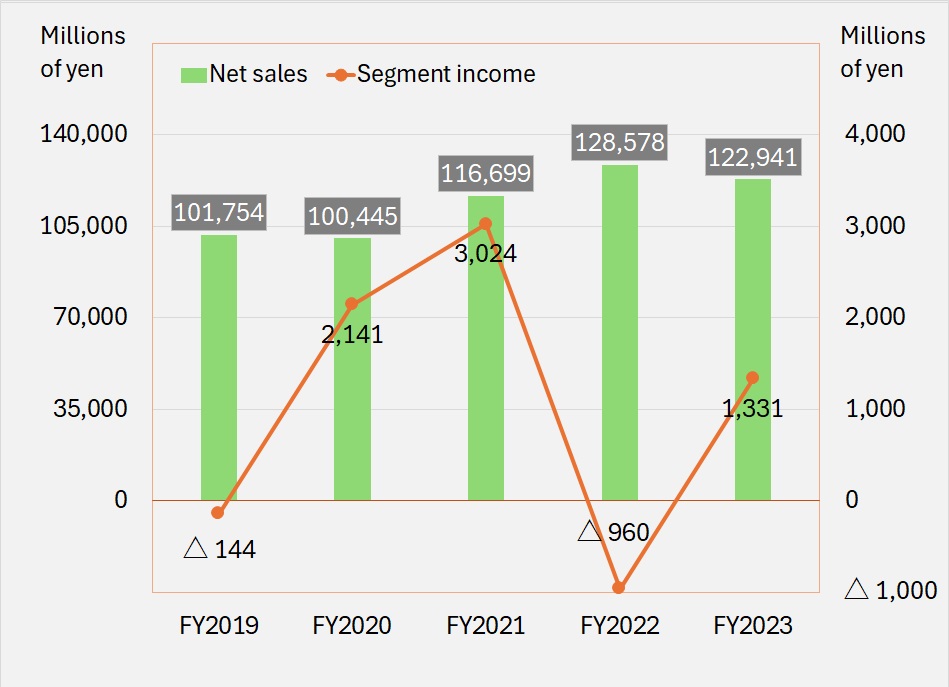
| Foods (Millions of yen) |
116,699 |
128,578 |
122,941 |
140,487 |
150,533 |
|
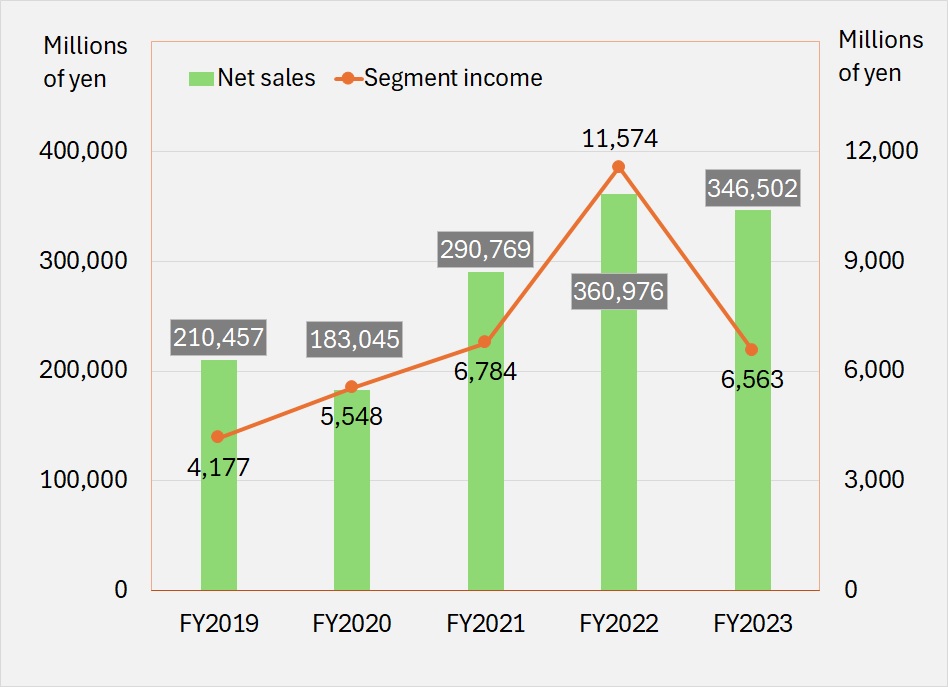
Energy & Living Materials (Millions of yen)
|
290,769 |
360,976 |
346,502 |
391,655 |
383,713 |
|
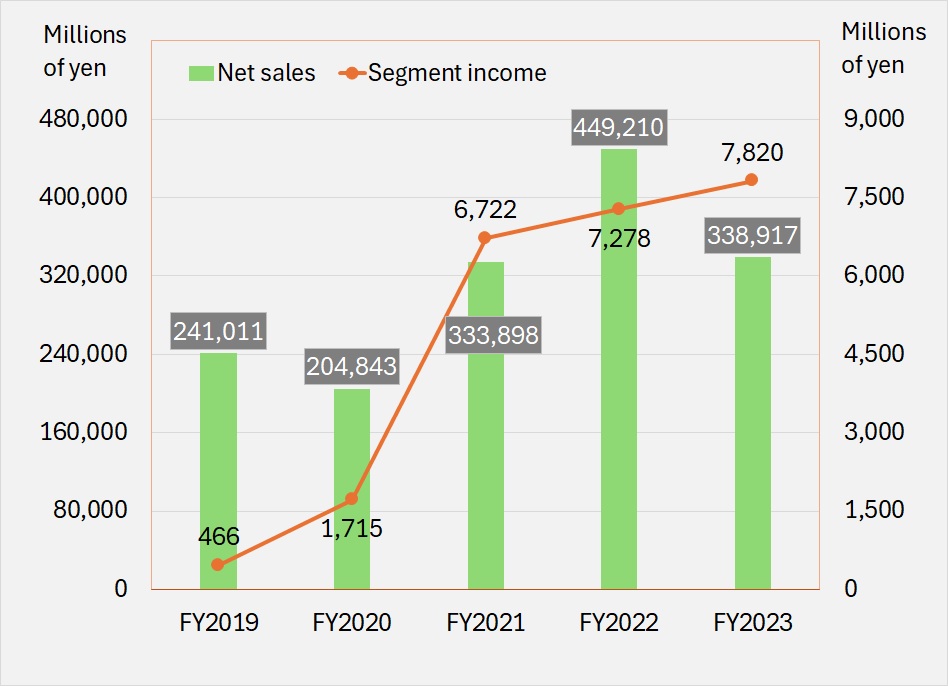
Overseas Sales Subsidiaries (Millions of yen)
|
333,898 |
449,210 |
338,917 |
441,319 |
517,705 |
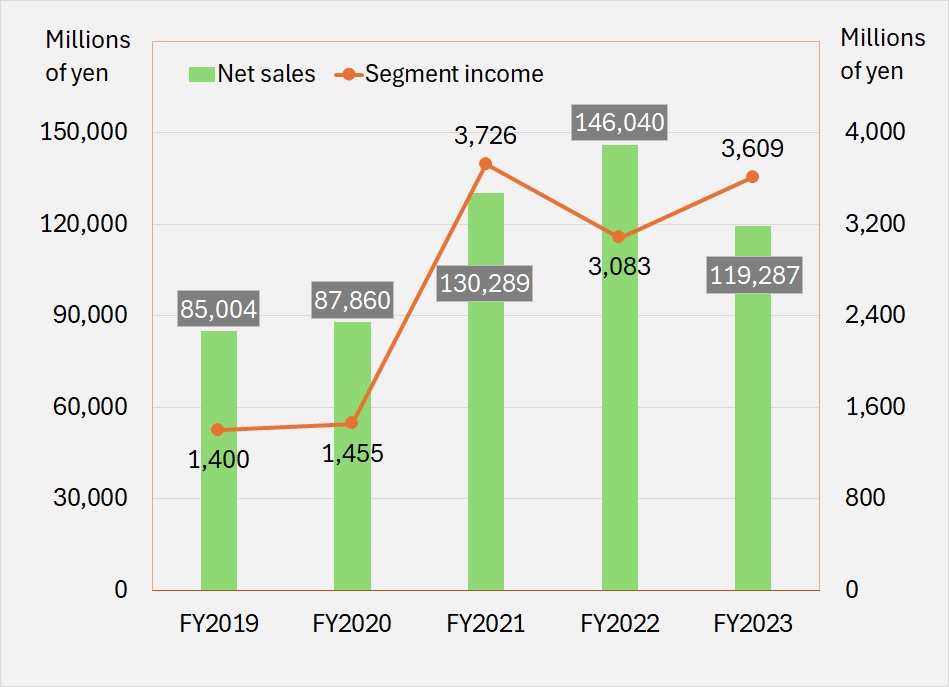
| Other Business (Millions of yen) |
130,289 |
146,040 |
119,287 |
133,744 |
133,926 |
| Adjustment (Millions of yen) |
-49,330 |
-99,937 |
-75,480 |
-118,998 |
-123,440 |
| Total |
2,164,049 |
2,668,228 |
2,431,980 |
2,554,514 |
2,662,669 |
Segment income
|
FY2021 |
FY2022 |
FY2023 |
FY2024 |
FY2025 |
| Steel (Millions of yen) |
35,958 |
28,477 |
25,617 |
33,130 |
38,707 |
| Primary Metal (Millions of yen) |
7,247 |
13,934 |
8,670 |
6,084 |
-150 |
|
Metal Recycling (Millions of yen)
|
2,883 |
6,135 |
1,134 |
3,098 |
1,302 |
| Foods (Millions of yen) |
3,024 |
-960 |
1,331 |
2,306 |
3,041 |
|
Energy & Living Materials (Millions of yen)
|
6,784 |
11,574 |
6,563 |
10,425 |
8,541 |
|
Overseas Sales Subsidiaries (Millions of yen)
|
6,722 |
7,278 |
7,820 |
8,278 |
5,528 |
| Other Business (Millions of yen) |
3,726 |
3,083 |
3,609 |
2,402 |
2,132 |
| Adjustment (Millions of yen) |
-3,628 |
-5,249 |
-6,470 |
-5,979 |
-6,840 |
| Total |
62,718 |
64,272 |
48,276 |
59,746 |
52,262 |
- Steel
-
- Primary Metal
-
- Metal Recycling
-
- Foods
-
- Energy & Living Materials
-
- Other business
-
- Overseas sales subsidiaries
-