Financial Highlights
Select Menu
- Main indexes of management conditions (consolidated)
- business segment
- Credit Ratings
Main indexes of management conditions (consolidated)
| FY2021 | FY2022 | FY2023 | FY2024 | FY2025 | |
|---|---|---|---|---|---|
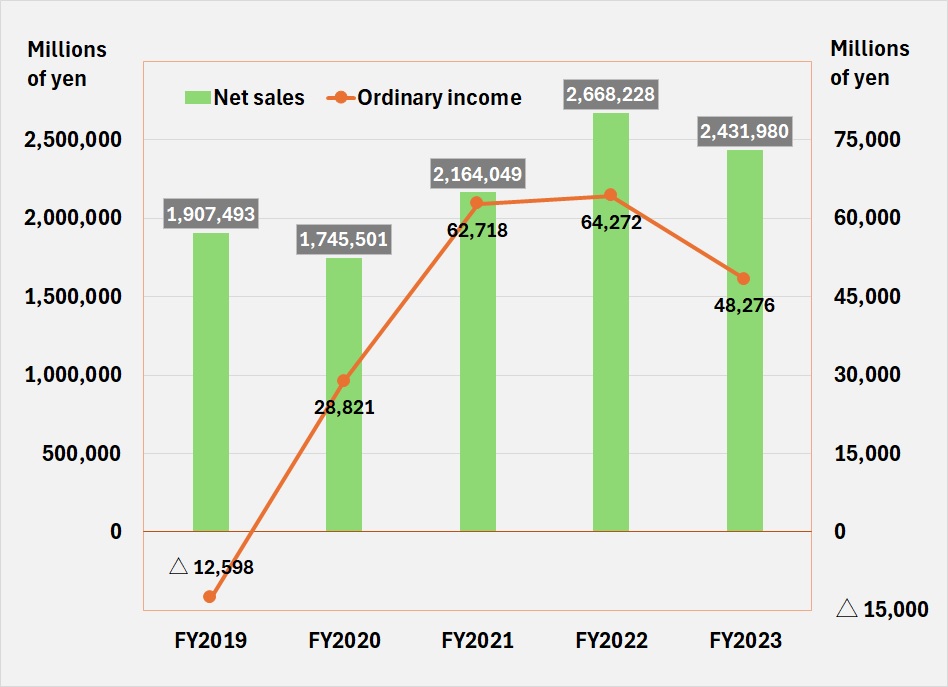
| Net sales (Millions of yen) | 2,164,049 | 2,668,228 | 2,431,980 | 2,554,514 | 2,662,669 |
| Ordinary income (Millions of yen) | 62,718 | 64,272 | 48,276 | 59,746 | 52,262 |
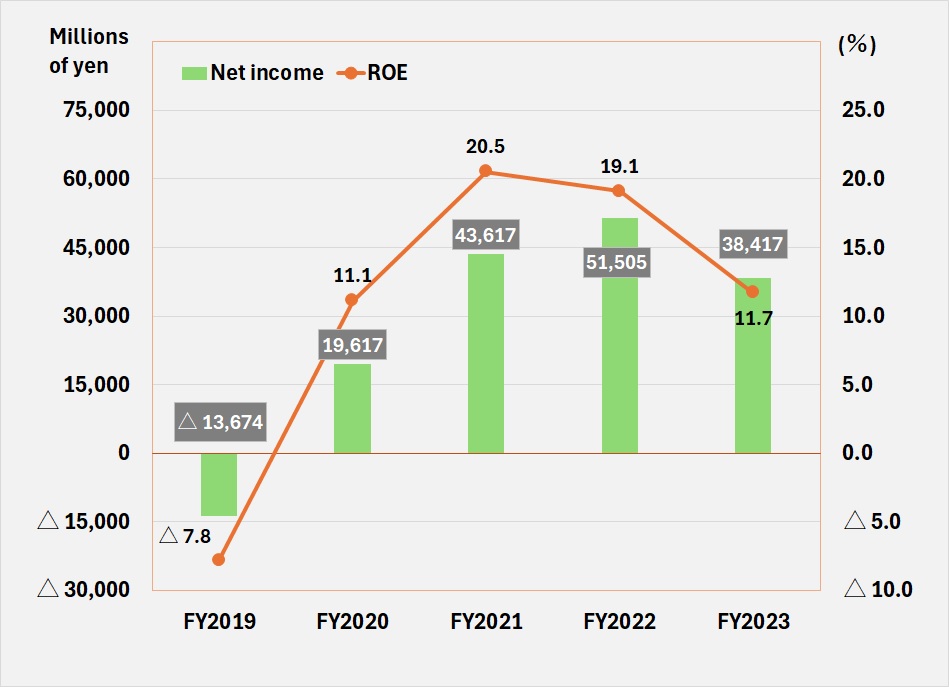
| Net income (Millions of yen) | 43,617 | 51,505 | 38,417 | 45,482 | 38,265 |
| Net assets (Millions of yen) | 240,497 | 308,807 | 356,765 | 389,470 | 432,951 |
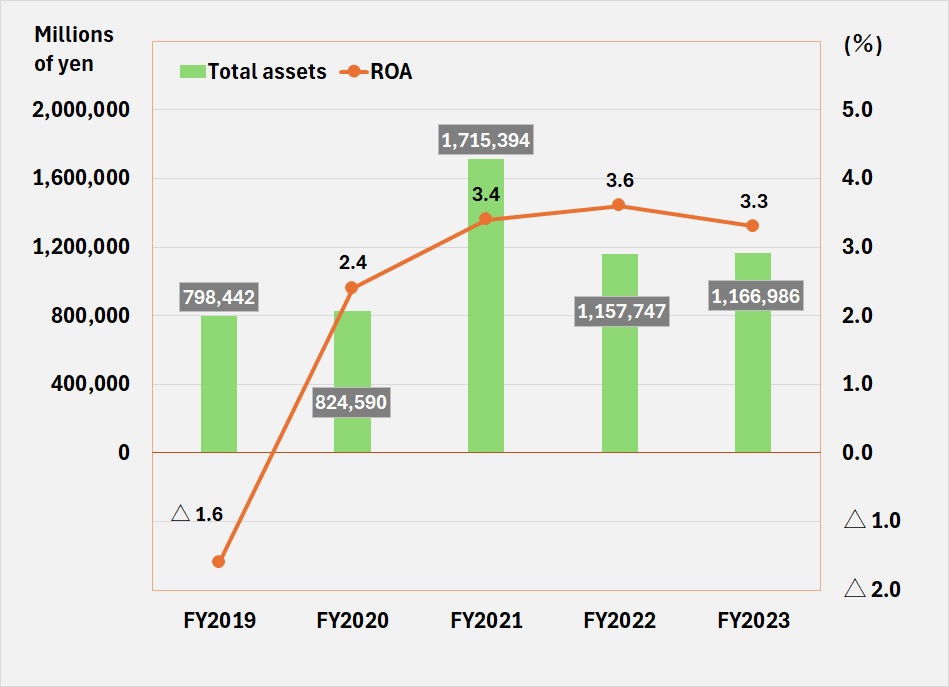
| Total assets (Millions of yen) | 1,715,394 | 1,157,747 | 1,166,986 | 1,165,805 | 1,212,662 |
| Shareholders' equity per share (yen) | 5,834.98 | 7,459.39 | 8,636.03 | 9,485.64 | 10,988.17 |
| Net income per share (yen) | 1,073.34 | 1,267.44 | 944.90 | 1,125.66 | 965.67 |
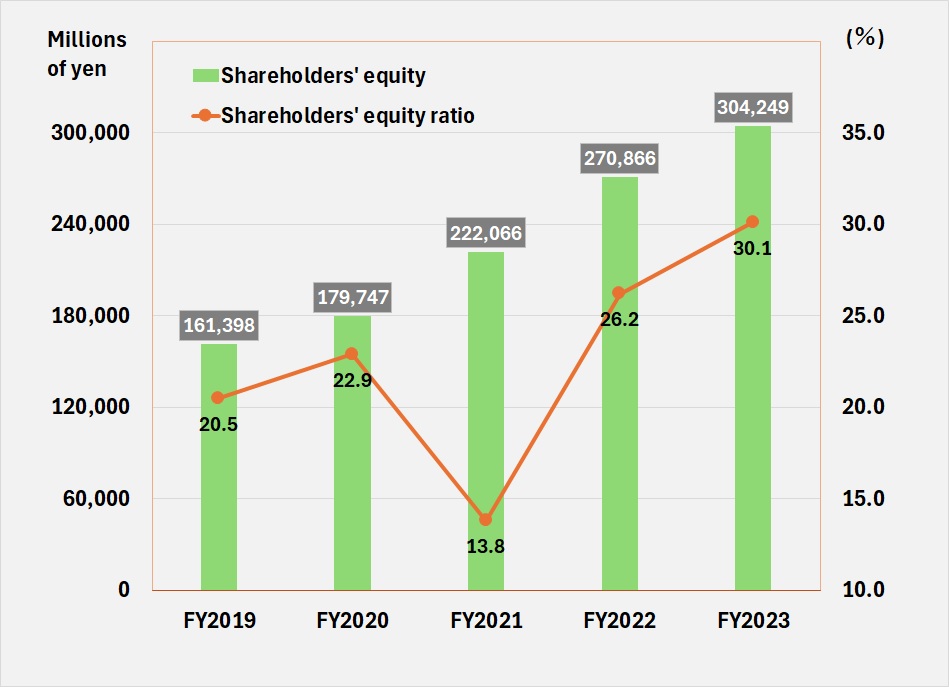
| Shareholders' equity ratio (%) | 13.8 | 26.2 | 30.1 | 32.9 | 35.3 |
| Ratio of net income to shareholders' equity (%) | 20.5 | 19.1 | 11.7 | 12.4 | 9.4 |
- Net sales and Ordinary income
-
- Net income and ROE
-
- Shareholders' equity
-
- Total assets and ROA
-
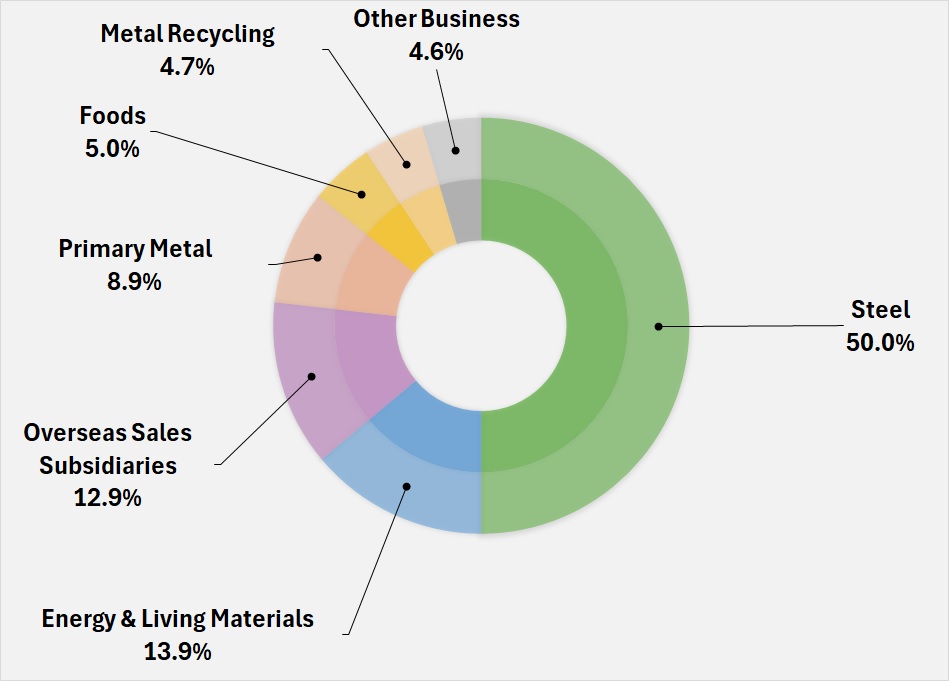
- Composition of Net Sales by Segment
-
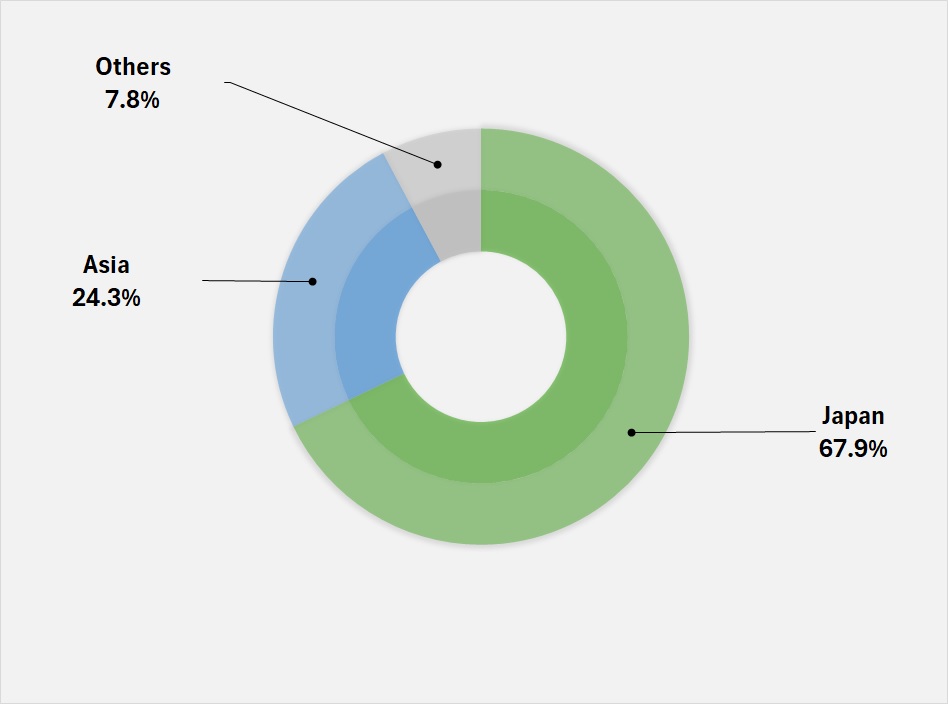
- Composition of Net Sales by Area
-